Mysteries of the Windows Kernel Pt.3 — Memory Management & Address Translation
categories: [Reverse Engineering, Security Research, Kernel Mode, Windows Internals] tags: [Reverse Engineering, Security Research, Kernel Mode, Windows Internals, Memory Management, WinDbg, IDA Pro]
Hello everyone, this article is the 3rd part of the “Mysteries of the Windows Kernel” series of articles. In this article I’ll talk about the following topics related to “Memory Management”.
Paging
In the Windows Operating System, the “Physical Memory” is being divided into “Pages”.
A “Page” is a memory block that resides in RAM and being used to store memory information that’s used by different components in the operating system at runtime.
Every process’ address space is built out of different chunks of pages with a different set of protections and states which I’ll soon explain. A ** “Chunk” is a set of memory pages that are physically contiguous and has the same memory protection and state.
There are 3 sizes of a “Page” memory block:
4KB (4096 Bytes) — The most common memory block size, and being used by default when allocating memory into a process.
2MB — A “Large Page”, a page size that is being used in a specific situations. It has its own pros and cons which I’ll talk about later in the article.
1GB — A “Huge Page”, a really big page size that’s also used for a very specific situations.
From now on, when I’ll mention a “Page” I mean a 4KB page size.
A page has multiple states:
Committed — A page (or a chunk) that is “Committed” means that it consumes “Physical Memory” (RAM) and is available for the process to use at runtime.
Reserved — A “Reserved” memory is a memory that isn’t allocated (doesn’t consume “Physical Memory”) but will be allocated in the future for a specific thing. It is “Reserved” for a specific purpose.
Free — A memory that is free is a memory that isn’t in a “Reserved” state or “Committed” state and can be allocated if required.
Everything that’s being explained will soon be demonstrated.
A “page” also has multiple protections. A “Protection” is a mechanism used to control access. Each page of memory can be marked with a set of protection attributes that determine whether a process can read, write or execute the content of the “page”.
The most protections are the following and is being used by multiple WINAPI function I’ll describe soon:
PAGE_EXECUTE — sets a page with an “Execute” permission. This means that the process can execute the content that resides within the “page”.
PAGE_READONLY — sets a page with a “Read” permission. This means that the process can read the content resides within the “page”.
PAGE_WRITE — sets a page with a “Write” permission. This means that the process can write information to the “page”.
PAGE_GUARD — This protection is a bit more complicated. A “PAGE_GUARD” is being a “one shot alert” mechanism that will invoke a “Page Guard” exception. After the exception occurs, the **“Page Guard” protection will be removed, and the memory will be accessible. This is being used as a way to examine different execution flows and some memory growth operations.
PAGE_NOACCESS — sets an unaccessible page.
These protections can also combined in the following ways:
PAGE_EXECUTE_READ - This is the main memory protection that’s being used in pages that stores code. For example, memory pages that hold DLL code in the virtual address space of a process.
PAGE_EXECUTE_WRITE — A memory protection that sets an “Execute” and “Write” protection over the page in memory.
PAGE_EXECUTE_READWRITE — A memory protection that sets “Read”, “Write”, “Execute” protection over the page in memory.
PAGE_READWRITE — A memory protection that sets “Read”, “Write”, protection over the page in memory.
Virtual Memory can be manipulated using the following WINAPI functions:
VirtualAlloc()— A WINAPI function that’s responsible to allocate virtual memory within a process address space.VirtualProtect()— A WINAPI function that’s responsible for changing the “Protection” of virtual memory.VirtualFree()— A WINAPI function that’s responsible for freeing allocated memory.WriteProcessMemory()— A WINAPI function that’s used for writing data into memory.
If you have some experience with malware development/Reverse Engineering you’ve probably came across these functions.
To demonstrate the usage of these functions and see how the memory manipulatin comes into play, I created the following C++ program, which we’re going to debug:
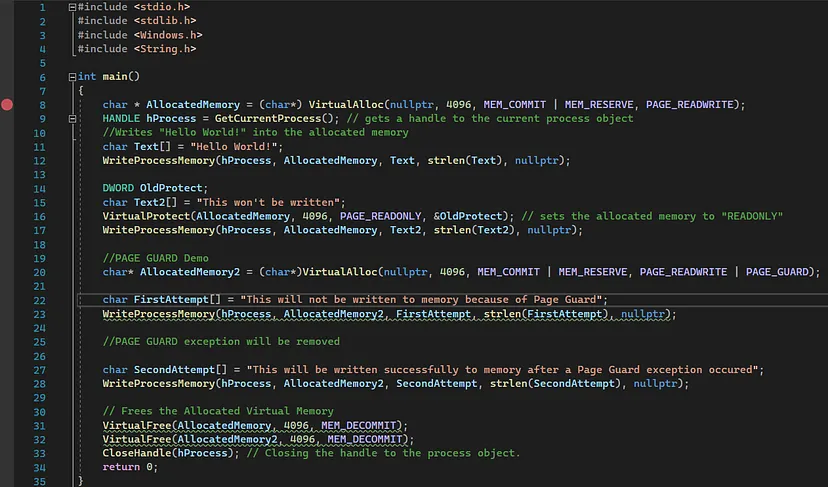
The first line will allocate 1 page in virtual memory of the process address space using the “VirtualAlloc()”. Allocating the memory in both “MEM_COMMIT” and “MEM_RESERVED” is the correct form of allocation, the reason for that is because before the allocated memory is being “Committed” to the virtual memory its being first “Reserved”. Setting only “MEM_COMMIT” only would also work, but its not the correct form of allocation. The allocated memory is also allocated with a “PAGE_READWRITE” permissions to it, allowing the process to only read and write content from the allocated memory chunk.
Executing the “VirtualAlloc()” and viewing the allocated memory in the “Memory 1” window of visual studio by typing the name of the variable, we can see the allocated memory filled with zeroes:

The next interesting function is the “WriteProcessMemory()” that comes multiple lines after it. This function will write the “Text” variable into the allocated memory:

As we can see “Hello World!” had been successfully written into the allocated chunk in the virtual address space of the process.
Now, the next thing the program is going to do is modify the protection state of the allocated memory into “PAGE_READONLY”, which means that the process can only read content from the allocated chunk. Then after the page protection modification, the “WriteProcessMemory()” function will attempt to write data into the allocated chunk.
Let’s execute that and see what happens (although the content within variable “Text2” has already spoiled what’s going to happen 😉):

As we can see, although we tried to execute the “WriteProcessMemory()” on that allocated chunk, because the protection of the chunk has been modified to “PAGE_READONLY”, the process is unable to write data into the allocated chunk, and as a result, the “Text2” variable wasn’t written to the chunk.
Guard Page
The next thing the program demonstrates is the idea of “Guard Page”, and in order to do that, the program will allocate a new chunk of 1 page in size of committed memory with a protection of “PAGE_GUARD” and “PAGE_READWRITE”. Then, we’ll view it in the “Memory 1” window:

As we can see, although the memory has been setted to be with “Committed”, it will still be considered as “Reserved” in memory because of the “PAGE_GUARD” protection.
Executing the first “WriteProcessMemory()” and attempting to write to memory the “FirstAttempt” variable, will invoke the “PAGE_GUARD” exception, which will remove the “Page Guard” protection and “Commit” the memory with a “PAGE_READWRITE” protection:

As we can see, the “WriteProcessMemory()” wasn’t working the first time, but the memory has been “Committed” into the virtual address space of the process and the “PAGE_GUARD” was removed.
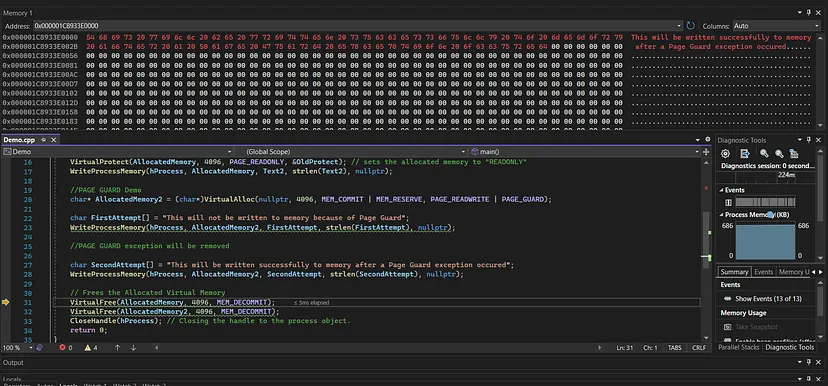
When we’ll try to execute the “WriteProcessMemory()” for the second time, the data will be written into the allocated chunk:
Now, before closing, we need to free the allocated memory and close the handle to the process. For that, we’ll use the “VirtualFree()” function with the “MEM_DECOMMIT” state, this will release the allocated memory, and to close the handle we’ll use the “CloseHandle()” API function:

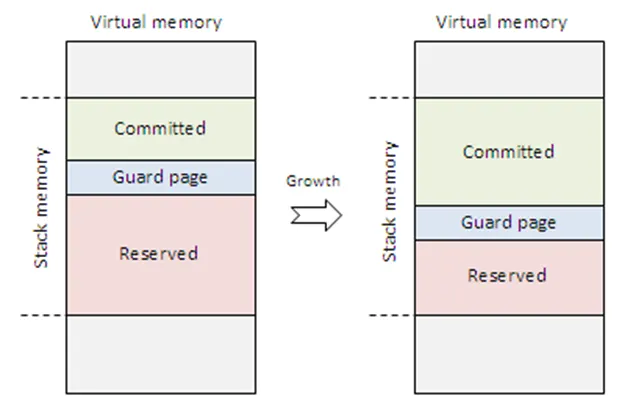
Another very important example for a “Guard Page” usage is thread’s stack. Mainly, a thread’s stack is consisted out of 3 parts:
- Committed Memory
- Guard Page
- Reserved Memory
https://geidav.wordpress.com/2013/03/21/anatomy-of-dynamic-stack-allocations/
When a thread needs more memory then what’s initially committed to its stack, it overflows into the “Guard Page”, which invokes an exception, then the “Committed” memory is being expanded, and the next page that comes after it become the “Guard Page”.
How does the “Memory Manager” (which a manager within the “Executive Subsystem” that’s responsible for managing memory) tracks the memory address space of every process?
The answer for that is through something called “Virtual Address Descriptor”.
Virtual Address Descriptor
“Virtual Address Descriptor” is an hierarichal data structure that each process has that is being used to manage and keep track of every memory chunk within the virtual address space of the process, it’s being maintained by the “Memory Manager” itself, so every memory that’s being “Committed”, “Reserved” or “Freed”, or any protection that’s being changed, are being reflected within the “Virtual Address Descriptor” of the process that the changes occur in.
There are 2 main ways to view the “Virtual Address Descriptor” of a process.
The first one is through WinDbg’s kernel debugging:
First, we’ll get information about the process using the !process extension command (For this example, I chose to get information about “lsass.exe” process): !process 0 1 lsass.exe

Then, execute the !vad extension command on the kernel memory address given in the “VadRoot” field:
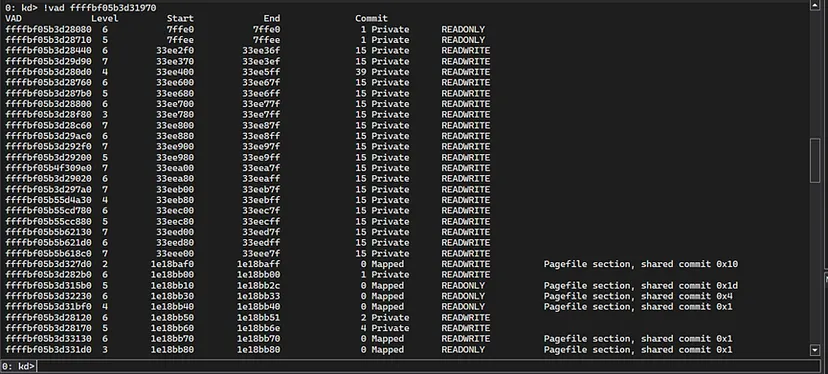
Using the !vad command, We can see the memory layout of the process, with a state, range, protection and depth level of the memory chunk within the “Virtual Address Descriptor” hierarical data structure.
In my opinion, the easiest way to view the representation of a “Virtual Address Descriptor” of a process is the second way and is through a SysInternals tool called “vmmap.exe”.
Let’s open “vmmap.exe”, and choose “msedge.exe” for example:
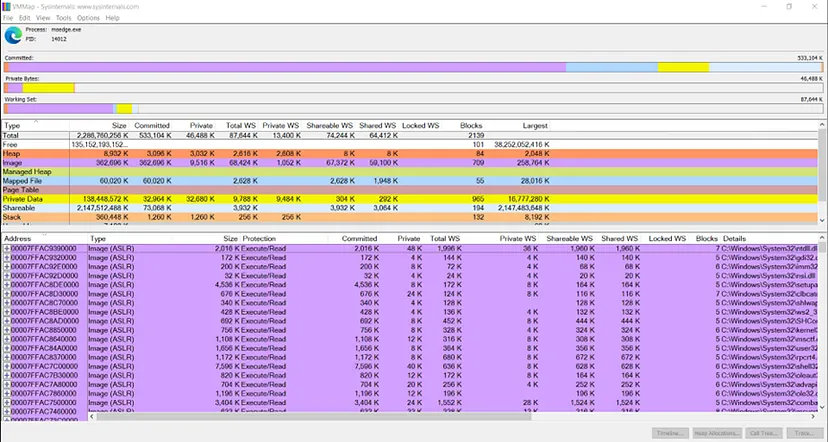
We can see that we have a very colorful and detailed information about layout of the virtual address space of the process.
We can see that we have multiple “Types” of memory that within the address space.
The most interesting memory types are:
Heap - All of the memory that has been dynamically allocated from the heap.
Mapped File - All of the memory that has been allocated through a “File Mapping” object, also known as a “Section” object in Kernel Mode. I’ll explain about it in detail soon.
Private Data - This is where the memory that has been allocated using functions such as “VirtualAlloc()” would reside. The “vmmap.exe” tool won’t be able to determine for which purpose the memory was allocated to, then it will put it in a “Private Data” type. A good exercise will be to take the code we debugged earlier and try to examine the changes in “vmmap.exe”.
Image - All of the PE images such as DLLs and EXE memory that has been loaded into the address space of the process will be classified as an “Image” memory type.
Stack - This is the memory type of all the stack memory that are being used by threads running under the process.
Through the “vmmap.exe”, we can see the memory layout of the stack and view how it’s being divided into “Committed”, “Page Guard” and “Reserved” memory:

Page File
A “Page File” is a special file that resides within a hard disk and is being used as an efficiency mechanism that allows extending RAM memory pages that aren’t being in use for a long period of time to be moved out (or more accurately “Paged Out”) into a special file on hard disk called “Page File”, this will make the usage of memory much more efficient because it will verify that only pages in memory that are relatively frequently being used will only reside in RAM. The “Page File” is called “pagefile.sys” and resides in the “C:\“ directory as an hidden file:

When a process attempts to access memory that has been “Paged Out” to the hard disk, the CPU will raise a “Page Fault” exception, which will then cause the “Memory Manger” to return the memory chunk from the “Page File” into the RAM itself. Memory can’t be executed from the “Page File”.
There are 2 types of “Page Fault”:
Hard Page Fault — A “Page Fault” that involves an I/O operation into the hard disk.
Soft Page Fault — A “Page Fault” that doesn’t involves an I/O operation into the hard disk. This will be explained later in the article.
In memory, there are mainly 2 types of information that will be stored:
- Code
- Data
In order to maximize efficiency in memory management, the idea of “Shared Memory” comes into play and allows multiple processes to share the same pages in RAM (“Physical Memory”).

https://www.amazon.com/Windows-Internals-Part-architecture-management/dp/0735684189
“pages” that store code, most of the time will be shared with the protection of “PAGE_EXECUTE_READ”, but “pages” that store data most of the time will hold a special protection called “Copy On Write” (COW).
“Copy On Write” is a special protection which allow multiple processes to share the same data, but when one of the processes attempt to write to the shared data pages, a “Copy On Write” exception will be invoked, and the “Memory Manager” will duplicate the shared data memory specifically for the process that was trying to perform the modification.
This allows multiple processes to share the same data without the fear of the data being modified by other process that shares the same memory.
The “Copy On Write” protection is not a must, and might not be used in shared memory that stores data within it. In a case where there’s no “Copy On Write” protection, any modification that will occur from one of the processes that is sharing the same memory data will be reflected in all the other processes sharing the same memory pages.
A common example of shared memory that hold code will be the .text section of a DLL, and a common example of shared memory that hold data will be the .data section of a DLL or EXE.
Here is an example in “vmmap.exe”:

After having that understanding, let’s break down some of the columns shown in “vmmap.exe”:

“Committed” — The entire committed memory of the memory type within the virtual address space of the process.
“Private” — Memory that is private and can’t be shared between multiple processes.
“Total WS” — WS stands for “Working Set”.
“Working Set” is memory that resides in “Physical Memory” (RAM) and accessing it won’t cause a “Page Fault”.
“Total WS” stands for the entire “Working Set” of the memory of the specific type.
“Private WS” — Memory that is considered a “Working Set” and is also considered “Private”, meaning that it can’t be shared between multiple processes.
“Shared WS” — Memory that considered a “Working Set” and shared between multiple processes. A memory can be shared by creating an object called “File Mapping” object, or “Section” object in Kernel Mode terminology.
Section Objects
“File Mapping”/”Section” object is a “Kernel Object” that is used as a “Shared Memory” that can be shared between multiple resources. A “Section” object must have some kind of “backup” in hard disk when being shared between multiple processes.
The first and most common option will be a regular file on disk, and the second option will be in the “Page File” itself. The only problem with storing it in a “Page File” is once all the references to the “Section” object are gone, the “Kernel Object” will be destroyed and the data within it will be deleted.
When using a regular file on disk that will serve as a “Hard Disk” backup, the data will be backed up and will be usable even if there are no processes that are using it at some point in time.
To create a “File Mapping object” or a “Section Object”, the following WINAPI/Native API function can be used:
CreateFileMapping()/NtCreateSection()— creates the “Section” object.MapViewOfFile()/NtMapViewOfSection()— maps the “Section” object into the virtual address space of the process.UnmapViewOfFile()/NtUnmapViewOfSection()— unmaps the “Section” object from the virtual address space of a process.
The most common example of the “Section” objects are the set of “KnownDLLs”, which we can view in a tool called “WinObj.exe”:

Let’s view information about “Section Objects” in a “Kernel Debugger”.
Let’s start by viewing the “KnownDLLs” object, which is a “Directory Object” that holds a list of “Section Objects” that are DLLs:
!object 0xFFFF800DB0C130C0

We can see that the list of DLLs that are under the “KnownDlls” Directory object are being listed, and they are objects of type “Section”, which means they are “Section”/”File Mapping” objects.
Clicking on the kernel address of “Kernel32.dll”, we can see information about the “Section Object” itself:

Viewing the _OBJECT_TYPE structure of the “Section” object:

We can see that the total number of “Section” objects are 0x745, total number of handles are 0x353, and we can also see that the maximum number of “Section” objects that can be created on the system are 0x846, and the total number of handles to “Section” objects are 0x35c.
Virtual Address Translation
“Virtual Address” is being used as a representation for “Physical Addresses” (The RAM memory itself). The idea of “Virtual Addresses” is to serve as an efficiency mechanism that will allow the operating system to manage memory in an efficient way, ensuring isolation between process’ memory, and allowing to share memory between processes in an effective and safe manner.
During execution, the MMU (“Memory Management Unit”) of the CPU performs a translation of a “Virtual Address” to a “Physical Address”. The following image shows the work of the CPU during Virtual to Physical address translation:

Let’s break everything down. During Virtual Address Translation, the CPU starts by getting a value of a field called “DirectoryTableBase” ( “DirBase”) which resides in the “KPROCESS” structure within the “EPROCESS” structure (3rd one in the image):

PCB stands for “Process Control Block” and that’s the name of the first field within the “_EPROCESS” structure that is used to holds the information within the “KPROCESS” structure.
As we can see, the “DirectoryTableBase” field is not formatted as a User Mode virtual address or a Kernel Mode virtual address, that’s because the “DirectoryTableBase” holds a direct “Physical Address”. It must be a “Physical Address”, otherwise we won’t be able to translate that to “Physical Address” and we won’t be able to translate address in the context of the process itself.
The “DirectoryTableBase” field is being putted in the “CR3” register (Control Register 3) and is serving as a base address for a “Physical Page” called “Page Map Level 4” (PML4).
After having the value setted within the CR3 register, the first thing the CPU does is to divide the 64 bit address (which is practically 48-bits addressing, this means that the left 16 bits of the address aren’t used in a virtual address translation) into the following parts:
- 9 bits
- 9 bits
- 9 bits
- 9 bits
- 12 bits
The first 9 bits value represents an index to an entry within “Page Map Level 4” which includes 512 entries of 8 bytes each (512 entries * 8 bytes = 4096 bytes = page size). This field is being used in the following way:
PML4 Base Address + (9 bits index * 8 bytes each entry).
This would result an address to another page size of physical values called “Page Directory Pointer Table”.
Then, the base address of the “Page Directory Pointer Table” (PDPT) will be used in the same formula as used in the “Page Map Level 4”:
PDPT Base Address + (9 bits index value (the 2nd 9 bits index value from the left) * 8 bytes each entry)
This would return a “Physical Address” of another page size of values called “Page Directory”, and again, another 9 bit value (the third one from the left) will be used in the same way:
Page Directory Base Address + 9 bits index value * 8 bytes
Then, a base address to another page of values called “Page Table” will be received, and the 4th 9 bits index value will be used in the same way to get the base address of the physical page in memory of the virtual address we’re trying to translate:
Page Table Base Address + 9 bits index value * 8 bytes
Then, to get the exact location within the “Physical Page” where the virtual address is referring to, the MMU ( “Memory Management Unit”) will take the rightest 12 bits of the virtual address as is and will append it to the base “Physical Address” of the “Physical Page” given from the last calculation performed.
Within every entry within the “Page Table”, the last 12 bits aren’t used directly for translation, but used for giving information for the CPU about the “Physical Page” that the CPU is going to interact with:

https://de-engineer.github.io/Virtual-Address-Translation-and-structure-of-PTE/
The leftest bit is “NX” ( “No Execute”) and is being used to specify whether “NX” is implemented on the “Physical Page”. Then, between 63–48, there is a reserved memory that will be used when the processor provide will support 57 bit addressing (48 bit addressing + 9 bits that will be used to map a specific address within a potential “Page Map Level 5” = 57).
The “PFN” - 36-bits.
The “W” bit stands for “Write” and tells whether the page is assigned with “Writable” permission.
The “P” bit stands for “Prototype” and tells whether the page is shared within multiple processes (through “Section Objects”/”File Mapping” which we previously seen).
The “Cw” bit stands for “Copy on Write” and tells whether the “Physical Page” is “Copy on Write” protected.
The “Gl” bit stands for “Global” and tells the MMU (“Memory Management Unit”) that the page shouldn’t be flushed to mechanism called “TLB” or “Translation Lookaside Buffer”.
The “TLB” serves as a caching mechanism to a previously translated addresses. The “TLB” is being used to avoid the translation process of some addresses that were already resolved previously.
The “L” bit stand for “Large” and it checks whether the desired “Physical Page” is a “Large Page” (a 2MB sized page).
The “D” bit stands for “Dirty” and it’s being used to tell whether the page was modified since the last time it was paged out into a “Page File”, and if an additional writing of the modification of the page to disk (specifically for the “Page File”) is required before detaching the memory from “Physical Memory”.
The “Cd” bit stands for “Cache Disabled”, and tells the MMU that this page shouldn’t be cached.
There are more bits, but the interesting one for us is the “Valid” bit, this bit tells the MMU whether the page is accessible and resides in “Physical Memory”, if not, a “Hardware Exception” will be raised of a “Page Fault”, which will call “KiPageFault()” and return the page from “Page File” back to “Physical Memory”. I’ll explain more about the idea of “Exceptions” in the next article.
To translate “Virtual Address” to “Physical Address” through WinDbg’s kernel debugging, we can use an extension command called “!vtop” (which stands for Virtual to Physical). The command takes 2 arguments, the first one is the DirectoryTableBase field, which for Kernel Mode addresses will always the “DirBase” field for the “System” (PID 4) process, and for user mode addresses it’s the “DirBase” field of the specific process that one of it’s addresses were trying to translate.
In this case, I’ll demonstrate a kernel address translation. Let’s start by getting the “DirBase” field of the “System” process:
!process 4 0

DirBase = 001aa000
Then, for our example, let’s try to translate the “EPROCESS” virtual address of the “System” process using the !vtop extension command:
!vtop 001aa000 ffffbf05ada64040
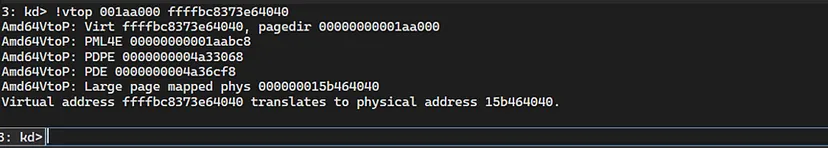
As we can see, the whole translation process as we described earlier is being performed automatically through WinDbg and the “Physical Address” received is: 15b464040
Viewing the information from “Virtual Memory” of the “EPROCESS” structure:
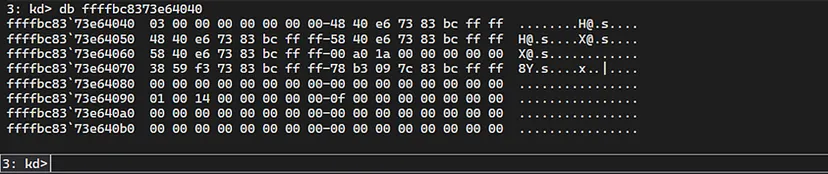
Viewing the information directly from “Physical Memory” of the “EPROCESS” structure:

We can see that both from “Physical Memory” and “Virtual Memory” the information within is the same, which confirms that the translation occurred successfully.
PFN Database
Previously, I mentioned a term called “PFN” (“Page Frame Number”).
The “Memory Manager” has to have some kind of database that he can use in order to keep track of the entire “Physical Memory”.
The “PFN Database” is a list of entires where each entry is of “_MMPFN” data structure and used to hold information about each “Physical Page” in memory. This can be thought as a “Virtual Address Descriptor” but instead for one process for the whole “Physical Memory” of the RAM.
The “PFN Database” is divided by itself to multiple lists in the following way:

https://flylib.com/books/en/4.491.1.69/1/
And the dynamic interaction between these lists are being performed as the following:

https://flylib.com/books/en/4.491.1.69/1/
Every access to a page that resides within the “Modified Page List” or the “Standby Page List” will cause a “Soft Page Fault” (A “Page Fault” that doesn’t require an I/O operation to the hard disk).
Let’s break down these lists:
Process Working Sets — Pages that are in the “Working Set” of processes are pages that are immediately available for the process without causing any “Page Fault”, not a “Hard Page Fault” and not a “Soft Page Fault”.
Free Page List - Pages that were freed to use from processes will be initially stored in the “Free Page List”. These free pages are still holding the information they’ve held when they were being used by one or more processes.
Zero Page List — Because the pages from the “Free Page List” still holds the information they’ve held from the process that was using them, it can be problematic from a security perspective.
It’s not safe that pages that were freed and might hold sensitive information will be reallocated with this information in memory once again to another process if this page might include some sensitive information within it. For that, there is a special thread called “Zero Page Thread” which is a thread with priority 0, and it’s being used in order to zero out pages from the “Free Page List” and transfer them into the “Zero Page List”, this thread runs whenever there is an Idle processor. Then, if a memory needs to be allocated in a “User Mode” process, it will be allocated zerored out from the “Zero Page List”.
That’s why when we performed the “VirtualAlloc()” at the beginning of the article, we received memory zeroed out, and not filled with junk from the previous process that was using it. Kernel-Mode memory can allocate memory both from “Zero Page List” and “Free Page List” that’s because “Kernel Mode” is considered a privileged level and there isn’t anything hidden from this level.
Bad Page List — Pages are being sorted into this list whenever there was an hardware error during the allocation of these pages and they aren’t usable.
Standby Page List — Pages that were in the “Working Set” of one or more processes, and haven’t been used in a while are being transferred from the “Working Set” to the “Standby Page List”. This is considered to be one step before being “Paged Out” into the “Page File”.
Modified Page List — Pages that aren’t in the “Working Set” and has been modified since the last time they were “Paged Out”. The modifications are being written into the “Page File” using a special thread called “Modified Page Writer”, which has a priority 0 and runs whenever a processor is idle and what it does is writes the modification into the “Page File”. After the modifications are being written, these pages transfers into the “Standby Page List”.
To view information about the consumption of these “Page Lists”, we can open “Process Explorer” → “View” → “System Information”:

As we can see, there is a “Paging Lists” section which shows the amount of KBs that are stored in each “Page List”.
We can see that the “Standby Page Lists” are divided into priorities. These priorities are the “Memory Priorities” of the pages. The default priority is “Priority 5” and the highest priority is “Priority 7”.
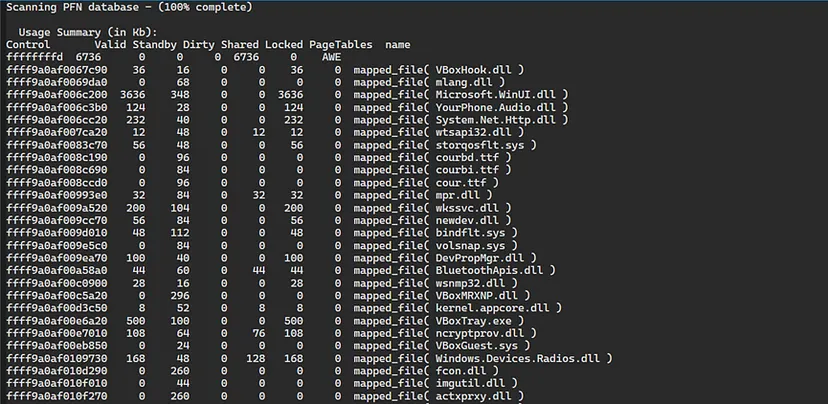
To view the entire PFN Database information, we can use a command called “!memusage” within WinDbg:

Let’s view the “PFN Entry” in the “PFN Database” of a “Physical Address”.
Let’s take a random “User Mode” Address using the “!process 0 0” command, which will list a basic information about all of the processes that are running in the system, for demonstration purposes, we’ll take the “csrss.exe” and view it’s PEB:

Suppose we want to translate the “Image Base Address” to “Physical Address”.

Let’s take the “DirBase” field of the process and take the address within the “ImageBaseAddress” and use it with the !vtop extension command:

Let’s display the information within the “Physical Address” and confirm that the address was translated successfully:

Now, the first thing we want is to get the base of the “PFN Database”, by executing:
?poi(nt!MmPfnDatabase)

PFN Database Base Address: ffffb100’00000000
The second thing we want to do is to get the index of the “PFN Entry” from the “Physical Address”. Because each page is 1000h (4096 bytes) we’ll need to divide the given “Physical Address” by the 1000h:

This calculation shows that the “PFN Index Number” is 13270C. In order to get to the base address of the “PFN Entry”, this is the calculation we’re going to do:
PFN Database Base Address + (PFN Index Number * sizeof(_Mmpfn”))
We can see that the size of the “_MMPFN” data structure is 0x30:
1
2
3
4
5
6
7
8
9
10
11
12
13
14
15
16
17
18
19
20
21
22
23
24
25
26
27
28
29
30
31
32
33
34
35
36
37
38
39
40
41
42
43
44
45
46
47
48
49
50
51
52
53
54
55
56
57
58
59
60
61
62
//0x30 bytes (sizeof)
struct _MMPFN
{
    union
    {
        struct _LIST_ENTRY ListEntry;                                       //0x0
        struct _RTL_BALANCED_NODE TreeNode;                                 //0x0
        struct
        {
            union
            {
                struct _SINGLE_LIST_ENTRY NextSlistPfn;                     //0x0
                VOID* Next;                                                 //0x0
                ULONGLONG Flink:40;                                         //0x0
                ULONGLONG NodeFlinkLow:24;                                  //0x0
                struct _MI_ACTIVE_PFN Active;                               //0x0
            } u1;                                                           //0x0
            union
            {
                struct _MMPTE* PteAddress;                                  //0x8
                ULONGLONG PteLong;                                          //0x8
            };
            struct _MMPTE OriginalPte;                                      //0x10
        };
    };
    struct _MIPFNBLINK u2;                                                  //0x18
    union
    {
        struct
        {
            USHORT ReferenceCount;                                          //0x20
            struct _MMPFNENTRY1 e1;                                         //0x22
        };
        struct
        {
            struct _MMPFNENTRY3 e3;                                         //0x23
        struct
        {
            USHORT ReferenceCount;                                          //0x20
        } e2;                                                               //0x20
        };
        struct
        {
            ULONG EntireField;                                              //0x20
        } e4;                                                               //0x20
    } u3;                                                                   //0x20
    struct _MI_PFN_ULONG5 u5;                                               //0x24
    union
    {
        ULONGLONG PteFrame:40;                                              //0x28
        ULONGLONG ResidentPage:1;                                           //0x28
        ULONGLONG Unused1:1;                                                //0x28
        ULONGLONG Unused2:1;                                                //0x28
        ULONGLONG Partition:10;                                             //0x28
        ULONGLONG FileOnly:1;                                               //0x28
        ULONGLONG PfnExists:1;                                              //0x28
        ULONGLONG NodeFlinkHigh:5;                                          //0x28
        ULONGLONG PageIdentity:3;                                           //0x28
        ULONGLONG PrototypePte:1;                                           //0x28
        ULONGLONG EntireField;                                              //0x28
    } u4;                                                                   //0x28
};
https://www.vergiliusproject.com/kernels/x64/windows-11/23h2/_MMPFN
After having everything needed, let’s view the “_MMPFN” data structure of the “PFN Entry” of the “Physical Address” we received:

We can see that every “_MMPFN” entry points to a “_MMPTE” structure which is a structure that’s being used by the “Memory Manager” to keep track of the “Page Table Entries” in memory.
Clicking on the “PteAddress” field to view the information within it:
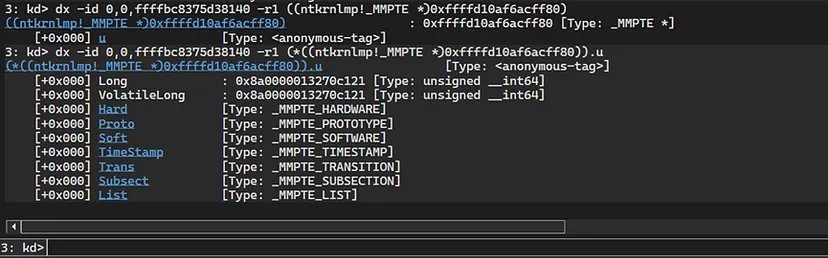
Clicking on the “HARD” link, which points to a “_MMPTE_HARDWARE” data structure:

We can see that the information shown in the image above is the same to what we’ve seen earlier in this image:
